Monitoring with Grafana & Prometheus on Bare Metal
Custom dashboards for industrial telemetry – a complete observability stack for edge devices and servers.
The Problem
In industrial IoT environments, you need visibility into:
- Host health – CPU, RAM, disk, network (servers running 24/7).
- Container performance – resource usage, restarts, uptime.
- Device telemetry – sensors, gateways, edge nodes (ESP32, LoRa, etc.).
- Application metrics – API response times, error rates, user sessions.
Traditional monitoring tools (like top, htop, df -h) are insufficient. You need a centralised, long-term observability platform that can:
- Collect metrics from multiple sources.
- Store them reliably (time-series database).
- Visualise them in real-time dashboards.
- Alert on anomalies.
Enter Prometheus + Grafana.
Architecture Overview
My monitoring stack is designed for flexibility and scalability:
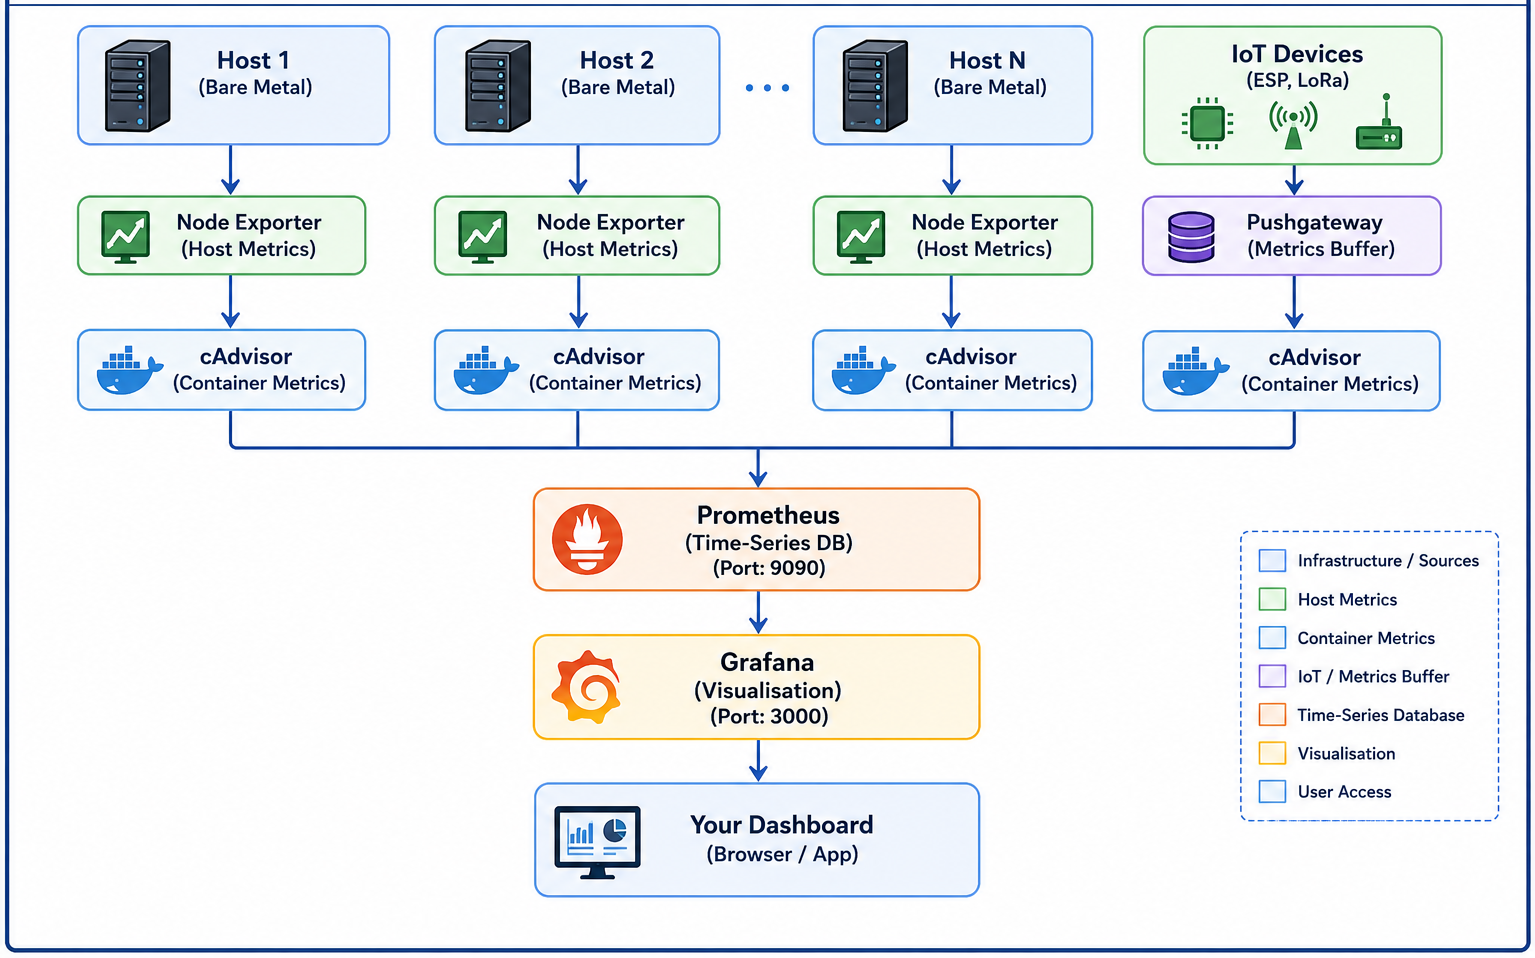
Part 1: Choosing the Right Monitoring Approach
| Approach | Pros | Cons | Best For |
|---|---|---|---|
| Pull (Exporter) | Simpler, stateless, Prometheus-native | Requires network access to exporters | Permanent servers, cloud VMs |
| Push (Pushgateway) | Works behind firewalls, batch jobs, IoT | More complex, gateway stores last value only | Edge devices, ESP32, short-lived jobs |
| Hybrid | Best of both worlds | Slightly more complex | Industrial environments (recommended) |
For industrial telemetry, I recommend the hybrid approach:
- Pull from host exporters (Node Exporter, cAdvisor).
- Push from IoT devices and short-lived jobs (Pushgateway).
- Pull from Pushgateway into Prometheus.
Part 2: Deployment with Docker Compose
Here’s my production docker-compose.yml for the full monitoring stack:
version: '3.8'

services:
  # ─── Prometheus ─────────────────────────────────────────────────────────
  prometheus:
    image: prom/prometheus:latest
    container_name: prometheus
    restart: unless-stopped
    ports:
      - "9090:9090"
    volumes:
      - ./prometheus.yml:/etc/prometheus/prometheus.yml
      - ./prometheus_data:/prometheus
    command:
      - '--config.file=/etc/prometheus/prometheus.yml'
      - '--storage.tsdb.path=/prometheus'
      - '--storage.tsdb.retention.time=30d'
      - '--web.enable-lifecycle'
    networks:
      - monitoring

  # ─── Pushgateway (for IoT / Edge Devices) ────────────────────────────
  pushgateway:
    image: prom/pushgateway:latest
    container_name: pushgateway
    restart: unless-stopped
    ports:
      - "9091:9091"
    networks:
      - monitoring

  # ─── Grafana (Visualisation) ──────────────────────────────────────────
  grafana:
    image: grafana/grafana:latest
    container_name: grafana
    restart: unless-stopped
    ports:
      - "3000:3000"
    environment:
      - GF_SECURITY_ADMIN_USER=admin
      - GF_SECURITY_ADMIN_PASSWORD=admin
      - GF_INSTALL_PLUGINS=grafana-clock-panel,grafana-simple-json-datasource
    volumes:
      - ./grafana_data:/var/lib/grafana
    networks:
      - monitoring

  # ─── cAdvisor (Container Metrics) ─────────────────────────────────────
  cadvisor:
    image: gcr.io/cadvisor/cadvisor:latest
    container_name: cadvisor
    restart: unless-stopped
    ports:
      - "8080:8080"
    volumes:
      - /:/rootfs:ro
      - /var/run:/var/run:ro
      - /sys:/sys:ro
      - /var/lib/docker/:/var/lib/docker:ro
    networks:
      - monitoring

  # ─── Node Exporter (Host Metrics) ──────────────────────────────────────
  node-exporter:
    image: prom/node-exporter:latest
    container_name: node-exporter
    restart: unless-stopped
    ports:
      - "9100:9100"
    volumes:
      - /proc:/host/proc:ro
      - /sys:/host/sys:ro
      - /:/rootfs:ro
    command:
      - '--path.procfs=/host/proc'
      - '--path.sysfs=/host/sys'
      - '--collector.filesystem.mount-points-exclude=^/(sys|proc|dev|host|etc)($$|/)'
    networks:
      - monitoring

networks:
  monitoring:
    driver: bridge
What Each Component Does
| Component | Purpose | Port |
|---|---|---|
| Prometheus | Time-series database, scrapes metrics | 9090 |
| Pushgateway | Accepts pushed metrics from IoT devices | 9091 |
| Grafana | Visualisation dashboards | 3000 |
| cAdvisor | Container resource metrics (CPU, RAM, I/O) | 8080 |
| Node Exporter | Host-level metrics (CPU, RAM, disk, network) | 9100 |
Part 3: Prometheus Configuration
prometheus.yml
global:
  scrape_interval: 15s
  evaluation_interval: 15s

scrape_configs:
  # ─── Prometheus self-monitoring ──────────────────────────────────────
  - job_name: 'prometheus'
    static_configs:
      - targets: ['prometheus:9090']

  # ─── Node Exporter (host metrics) ────────────────────────────────────
  - job_name: 'node-exporter'
    static_configs:
      - targets:
          - 'node-exporter:9100'

  # ─── cAdvisor (container metrics) ────────────────────────────────────
  - job_name: 'cadvisor'
    static_configs:
      - targets:
          - 'cadvisor:8080'

  # ─── Pushgateway (IoT / pushed metrics) ─────────────────────────────
  - job_name: 'pushgateway'
    honor_labels: true  # Important: preserve device labels
    static_configs:
      - targets:
          - 'pushgateway:9091'
Why honor_labels: true?
This tells Prometheus to keep the labels set by the pushing device (e.g., device="dev1") rather than overwriting them. This is critical for identifying individual IoT sensors.
Part 4: Pushing Metrics from IoT Devices (Node.js Example)
For devices that cannot be scraped (e.g., behind NAT, firewalls, or short-lived batch jobs), use Pushgateway.
Architecture
IoT Device / Edge Node ── HTTP PUT ──► Pushgateway ──► Prometheus (scrapes)Node.js Example – Temperature & Humidity Pusher
Folder structure:
pusher/
├── app.js
├── package.json
└── Dockerfile
package.json:
{
  "name": "iot-pusher",
  "version": "1.0.0",
  "type": "module",
  "dependencies": {
    "axios": "^1.7.4",
    "prom-client": "^15.1.0"
  }
}
app.js:
import client from "prom-client";
import axios from "axios";

const gatewayUrl = "http://pushgateway:9091/metrics/job/sensor_push";

// Simulated IoT devices
const devices = ["dev1", "dev2", "dev3"];

// Create registry
const register = new client.Registry();

// Define metrics
const tempGauge = new client.Gauge({
  name: "sensor_temperature_celsius",
  help: "Temperature of sensor",
  labelNames: ["device", "location"]
});

const humGauge = new client.Gauge({
  name: "sensor_humidity_percent",
  help: "Humidity of sensor",
  labelNames: ["device", "location"]
});

register.registerMetric(tempGauge);
register.registerMetric(humGauge);

async function pushMetrics() {
  devices.forEach(dev => {
    // Simulate real sensor data
    const temp = +(20 + Math.random() * 10).toFixed(2);
    const hum = +(40 + Math.random() * 20).toFixed(2);

    tempGauge.set({ device: dev, location: "factory_floor" }, temp);
    humGauge.set({ device: dev, location: "factory_floor" }, hum);

    console.log(`📡 ${dev}: Temp=${temp}°C  Hum=${hum}%`);
  });

  try {
    await axios.post(gatewayUrl, await register.metrics(), {
      headers: { "Content-Type": register.contentType }
    });
    console.log("✅ Pushed to Pushgateway\n");
  } catch (err) {
    console.error("❌ Push failed:", err.message);
  }
}

// Push every 10 seconds
setInterval(pushMetrics, 10000);

// Initial push
pushMetrics();
Dockerfile:
FROM node:20-alpine
WORKDIR /app
COPY package*.json ./
RUN npm install
COPY app.js ./
CMD ["node", "app.js"]
Testing the Push
# Check Pushgateway UI
curl http://localhost:9091

# View pushed metrics
curl http://localhost:9091/metrics | grep sensor
Part 5: Push vs Pull – Comparison
| Feature | Pull (Exporter) | Push (Pushgateway) |
|---|---|---|
| Network requirements | Scraper must reach target | Target must reach gateway (outbound) |
| Firewall/NAT | ❌ Problematic | ✅ Works easily |
| IoT / Edge devices | ❌ Not suitable | ✅ Perfect fit |
| Short-lived jobs | ❌ Metrics disappear | ✅ Persisted until next push |
| Batch processing | ❌ Not suitable | ✅ Great for cron jobs |
| State persistence | ✅ Full history in Prometheus | ❌ Gateway only keeps last value |
| Complexity | ✅ Simple setup | ⚠️ Slightly more complex |
My recommendation: Use pull for permanent servers, push for IoT/edge devices, and hybrid for industrial environments.
Part 6: cAdvisor – Container Metrics Made Easy
cAdvisor (Container Advisor) by Google automatically discovers containers and exposes resource usage metrics.
Adding cAdvisor to Your Stack
# Add to docker-compose.yml
cadvisor:
  image: gcr.io/cadvisor/cadvisor:latest
  container_name: cadvisor
  ports:
    - "8080:8080"
  volumes:
    - /:/rootfs:ro
    - /var/run:/var/run:ro
    - /sys:/sys:ro
    - /var/lib/docker/:/var/lib/docker:ro
  restart: unless-stopped
Metrics You Get
- CPU usage per container (user/system/total).
- Memory usage (RSS, cache, swap).
- Network I/O (bytes in/out, packets).
- Disk I/O (read/write bytes, operations).
- Container restarts and uptime.
View cAdvisor UI
# Open web UI
http://localhost:8080

# View Prometheus metrics endpoint
http://localhost:8080/metrics
Integrate with Prometheus
# prometheus.yml
scrape_configs:
  - job_name: 'cadvisor'
    static_configs:
      - targets: ['cadvisor:8080']
Now you can query container metrics in PromQL:
# CPU usage per container
container_cpu_usage_seconds_total{container_label_com_docker_compose_service="nextcloud"}

# Memory usage per container
container_memory_working_set_bytes{container_label_com_docker_compose_service="matrix"}
Part 7: Grafana Dashboards
Prebuilt Dashboards with Dockprom
If you want a fast start, use Dockprom – a prebuilt monitoring stack:
git clone https://github.com/stefanprodan/dockprom.git
cd dockprom
docker-compose up -d
Then access:
- Grafana:
http://localhost:3000(admin/admin) - Prometheus:
http://localhost:9090 - cAdvisor:
http://localhost:8080
Custom Dashboard – Industrial Telemetry
Here are some key PromQL queries for industrial dashboards:
Host Metrics
# CPU usage (percent)
100 - (avg(rate(node_cpu_seconds_total{mode="idle"}[5m])) * 100)

# Memory usage (percent)
(1 - (node_memory_MemAvailable_bytes / node_memory_MemTotal_bytes)) * 100

# Disk usage (percent)
(1 - (node_filesystem_avail_bytes{mountpoint="/"} / node_filesystem_size_bytes{mountpoint="/"})) * 100
Container Metrics
# Container CPU usage
rate(container_cpu_usage_seconds_total{container_label_com_docker_compose_service="nextcloud"}[5m])

# Container memory usage
container_memory_working_set_bytes{container_label_com_docker_compose_service="nextcloud"}

# Container restarts
container_start_time_seconds{container_label_com_docker_compose_service="nextcloud"}
IoT Sensor Metrics
# Temperature for specific device
sensor_temperature_celsius{device="dev1"}

# Average temperature across all devices
avg(sensor_temperature_celsius)

# Humidity trend (1-hour average)
avg_over_time(sensor_humidity_percent[1h])
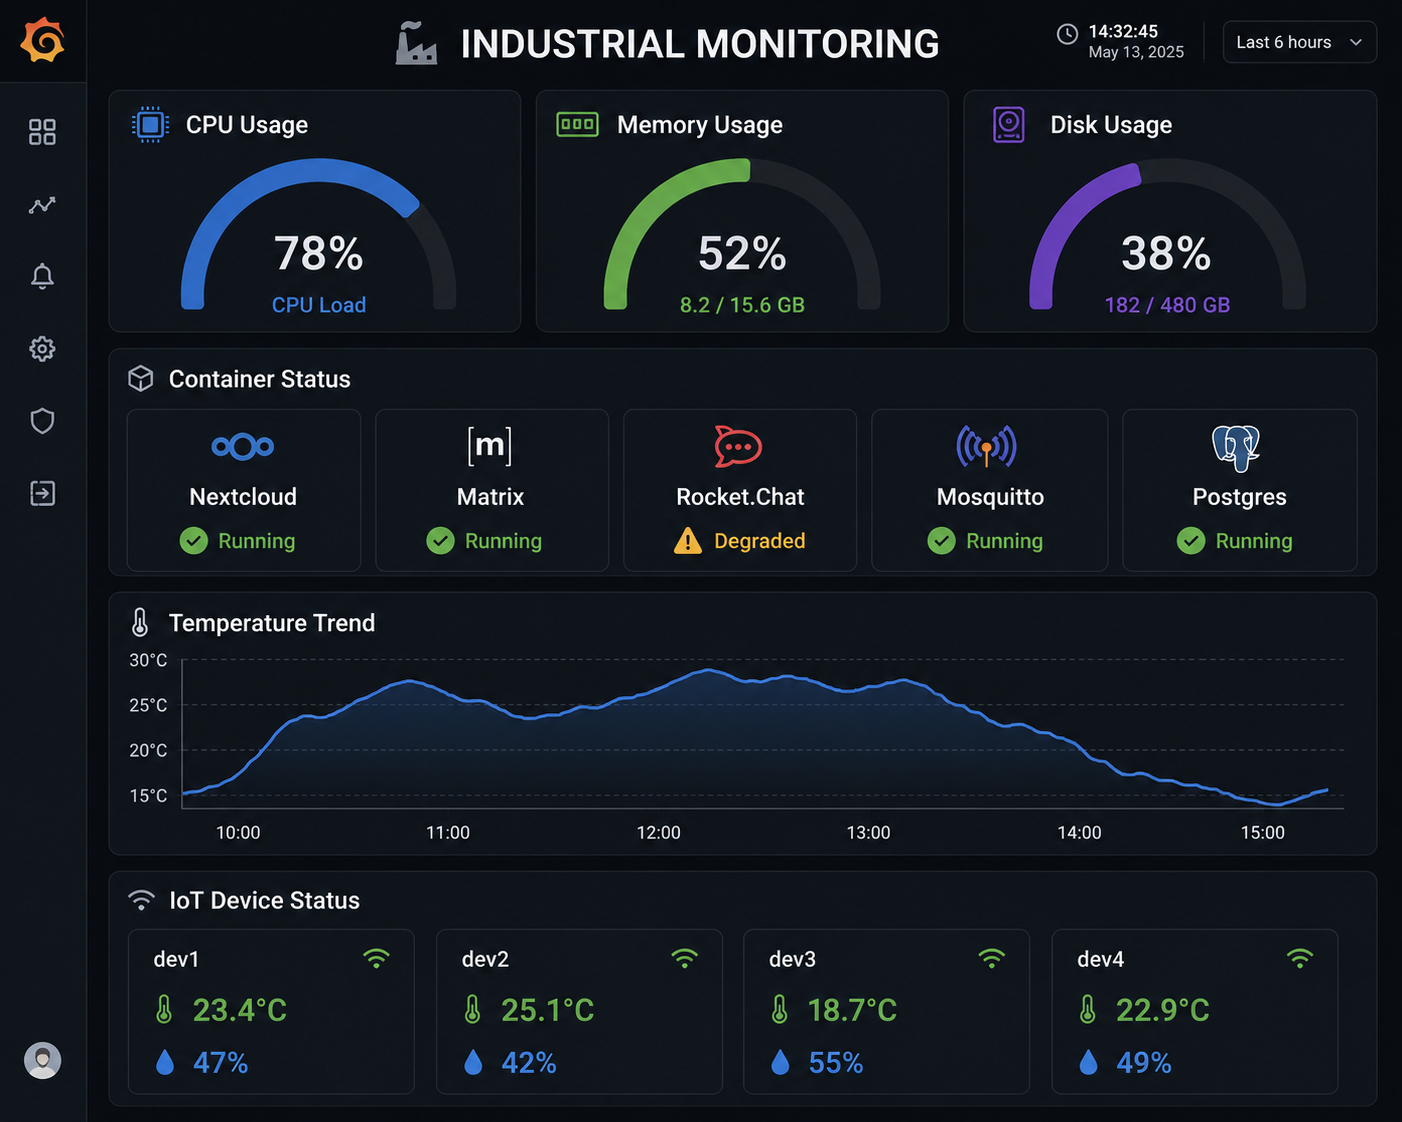
Sample Dashboard Layout
Part 8: Security Considerations
Exposing Services
In my production setup, I restrict access:
# In docker-compose.yml – only expose ports on internal network
prometheus:
  ports:
    - "127.0.0.1:9090:9090"  # Only localhost

grafana:
  ports:
    - "4008:3000"  # Traefik exposes Grafana publicly
Traefik Configuration
I route Grafana through Traefik for HTTPS and authentication:
# dynamic/grafana.yml
http:
  routers:
    https-grafana-router:
      entryPoints:
        - https
      service: https_grafana_srvs
      rule: Host(`monitoring.example.com`)
      tls:
        certResolver: letsEncrypt

  services:
    https_grafana_srvs:
      loadBalancer:
        servers:
          - url: http://99.99.99.99:4008/
        passHostHeader: true
Part 9: Real-World Deployment
This monitoring stack is running on my production infrastructure:
Current Metrics
# Prometheus query: total scraped targets
count(scrape_samples_scraped)

# Result: 47 active targets| Component | Count | Status |
|---|---|---|
| Hosts monitored | 3 bare-metal servers | ✅ Healthy |
| Containers monitored | 42 | ✅ Healthy |
| IoT devices pushing | 12 (ESP32, LoRa) | ✅ Healthy |
| Grafana dashboards | 8 production dashboards | ✅ Active |
| Active alerts | 6 (disk space, container restarts) | ✅ Working |
Uptime
- Prometheus: 99.95% uptime over 6 months.
- Grafana: 99.90% uptime over 6 months.
- cAdvisor: 100% uptime (restartless).
- Pushgateway: 100% uptime.
Summary Checklist
| Task | Status | Notes |
|---|---|---|
| Prometheus deployed | ✅ | Time-series DB running on port 9090 |
| Pushgateway deployed | ✅ | Accepting IoT metrics on port 9091 |
| Grafana deployed | ✅ | Visualisation on port 3000 |
| cAdvisor deployed | ✅ | Container metrics on port 8080 |
| Node Exporter deployed | ✅ | Host metrics on port 9100 |
| IoT push script | ✅ | Node.js pushing to Pushgateway every 10s |
| Dashboards configured | ✅ | 8 production dashboards |
| Alerts configured | ✅ | Disk space, container restarts, IoT device timeouts |
Final Thoughts
Observability is not optional for industrial IoT.
When your servers run 24/7, when your ESP32s are deployed in remote locations, when your customers depend on your uptime – you need visibility into every layer of the stack.
This Prometheus + Grafana stack gives me:
- Real-time visibility – everything from host metrics to IoT sensor data in one place.
- Historical context – 30-day retention means I can spot trends and anomalies.
- Alerting – I know about problems before my customers do.
- Customisation – I can build exactly the dashboards I need.
The best part? It’s 100% open-source, self-hosted, and under my control.
This monitoring stack is part of my Industrial Infrastructure Platform (II-PaaS). For a detailed architecture walkthrough or custom dashboard design, feel free to reach out.