Monitoring & Telemetry
Production-grade observability for industrial IoT – real-time monitoring of hosts, containers, and distributed edge devices.
Overview
In industrial environments, visibility is everything. When servers run 24/7 and edge devices are deployed in remote locations, you need a centralised observability platform that provides:
- Real-time metrics – CPU, RAM, disk, network, temperature.
- Historical context – 30-day retention for trend analysis.
- Alerting – Know about problems before your customers do.
- Unified view – Hosts, containers, and IoT devices in one place.
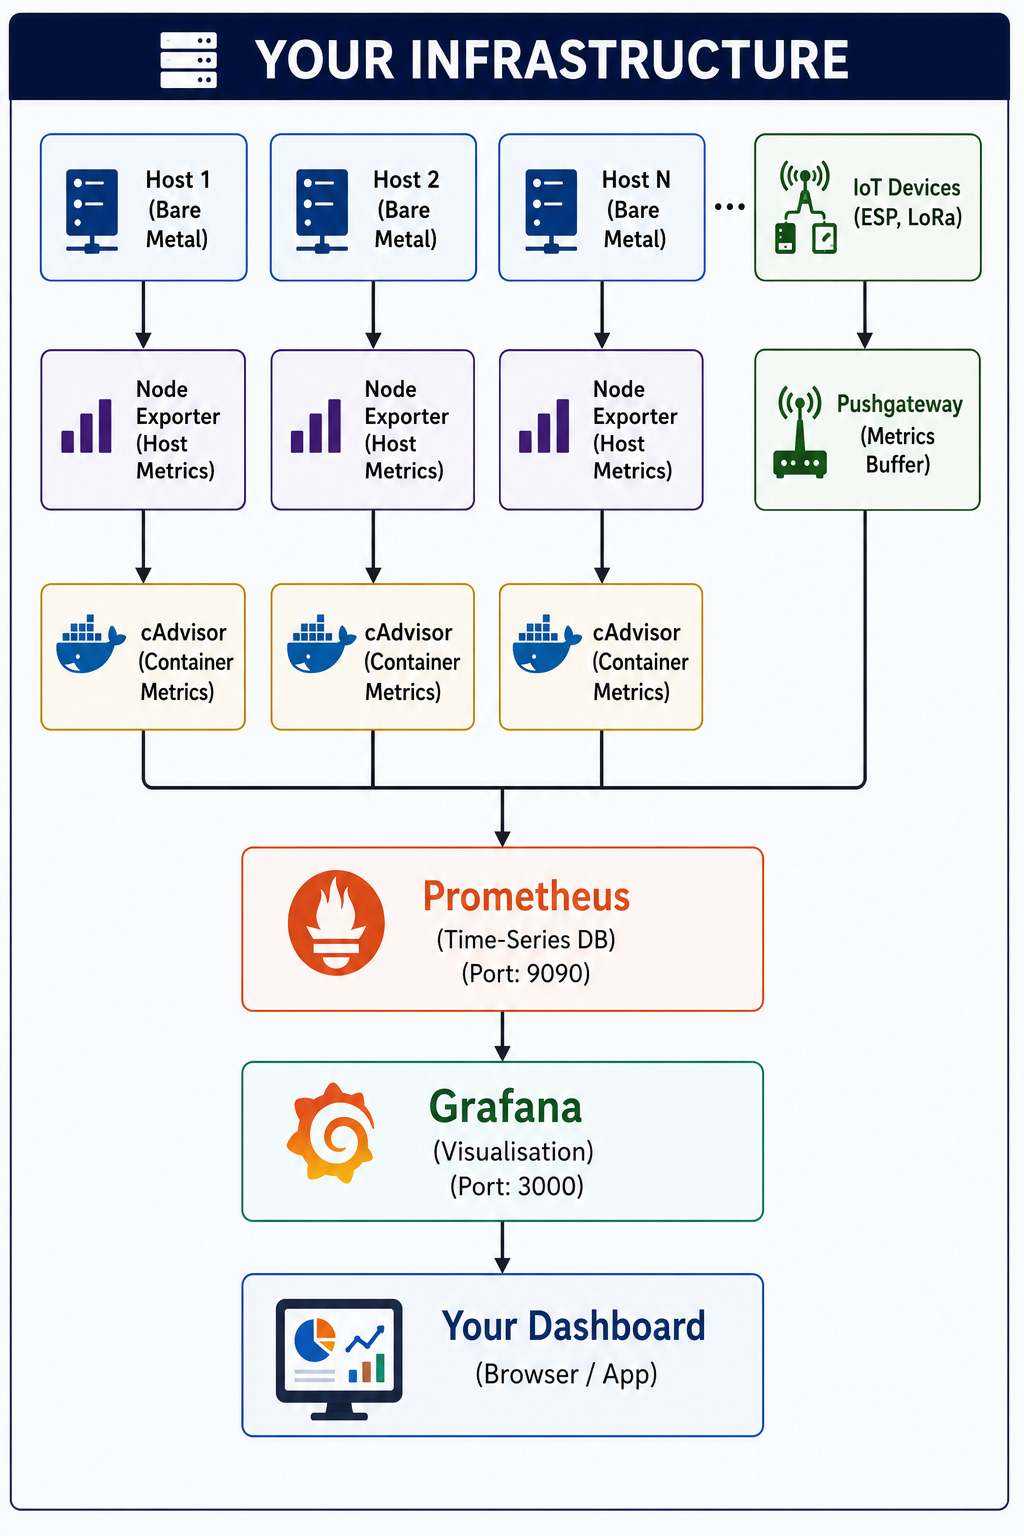
My monitoring stack is built on Prometheus (time-series database) and Grafana (visualisation), extended with Pushgateway for IoT devices and cAdvisor for container metrics.
Architecture Overview
Core Components
1. 📊 Prometheus – Time-Series Database
Prometheus is the heart of the monitoring stack. It scrapes metrics from exporters, stores them efficiently, and provides a powerful query language (PromQL).
Key Features:
- Pull-based – Scrapes metrics every 15 seconds.
- Multi-dimensional data – Labels for flexible querying.
- Powerful PromQL – Complex aggregations and alerts.
- 30-day retention – Historical trend analysis.
- Self-monitoring – Metrics about Prometheus itself.
Configuration:
global:
  scrape_interval: 15s
  evaluation_interval: 15s

scrape_configs:
  - job_name: 'node-exporter'
    static_configs:
      - targets: ['node-exporter:9100']

  - job_name: 'cadvisor'
    static_configs:
      - targets: ['cadvisor:8080']

  - job_name: 'pushgateway'
    honor_labels: true
    static_configs:
      - targets: ['pushgateway:9091']
2. 🖥️ Node Exporter – Host Metrics
Node Exporter exposes hardware and OS metrics for each host:
| Metric Category | Examples |
|---|---|
| CPU | Usage, load average, time spent per mode |
| Memory | Total, available, used, swap |
| Disk | Usage, I/O operations, read/write speeds |
| Network | Bytes in/out, packets, errors |
| System | Uptime, processes, file descriptors |
Deployment:
node-exporter:
  image: prom/node-exporter:latest
  ports:
    - "9100:9100"
  volumes:
    - /proc:/host/proc:ro
    - /sys:/host/sys:ro
    - /:/rootfs:ro
  command:
    - '--path.procfs=/host/proc'
    - '--path.sysfs=/host/sys'
3. 🐳 cAdvisor – Container Metrics
cAdvisor (Container Advisor) by Google automatically discovers containers and exposes resource usage:
| Metric | Description |
|---|---|
| CPU | User, system, total usage per container |
| Memory | RSS, cache, swap usage |
| Network | Bytes and packets in/out |
| Disk I/O | Read/write bytes and operations |
| Restarts | Container uptime and restart count |
Deployment:
cadvisor:
  image: gcr.io/cadvisor/cadvisor:latest
  ports:
    - "8080:8080"
  volumes:
    - /:/rootfs:ro
    - /var/run:/var/run:ro
    - /sys:/sys:ro
    - /var/lib/docker/:/var/lib/docker:ro
4. 📡 Pushgateway – IoT Telemetry
For devices that cannot be scraped (behind NAT, firewalls, or short-lived jobs), Pushgateway accepts pushed metrics:
Architecture:
IoT Device ── HTTP PUT ──► Pushgateway ──► Prometheus (scrapes)Use Cases:
- ESP32 / ESP8266 sensors – Push temperature/humidity data.
- Batch jobs – Push metrics from cron jobs.
- Edge devices – Behind firewalls or mobile networks.
- Short-lived tasks – Metrics that disappear after process ends.
Example: Pushing from Node.js
import client from "prom-client";
import axios from "axios";

const gatewayUrl = "http://pushgateway:9091/metrics/job/sensor_push";

const tempGauge = new client.Gauge({
  name: "sensor_temperature_celsius",
  help: "Temperature of sensor",
  labelNames: ["device", "location"]
});

async function pushMetrics() {
  tempGauge.set({ device: "dev1", location: "factory_floor" }, 23.5);

  await axios.post(gatewayUrl, await register.metrics(), {
    headers: { "Content-Type": register.contentType }
  });
}
5. 🎨 Grafana – Visualisation
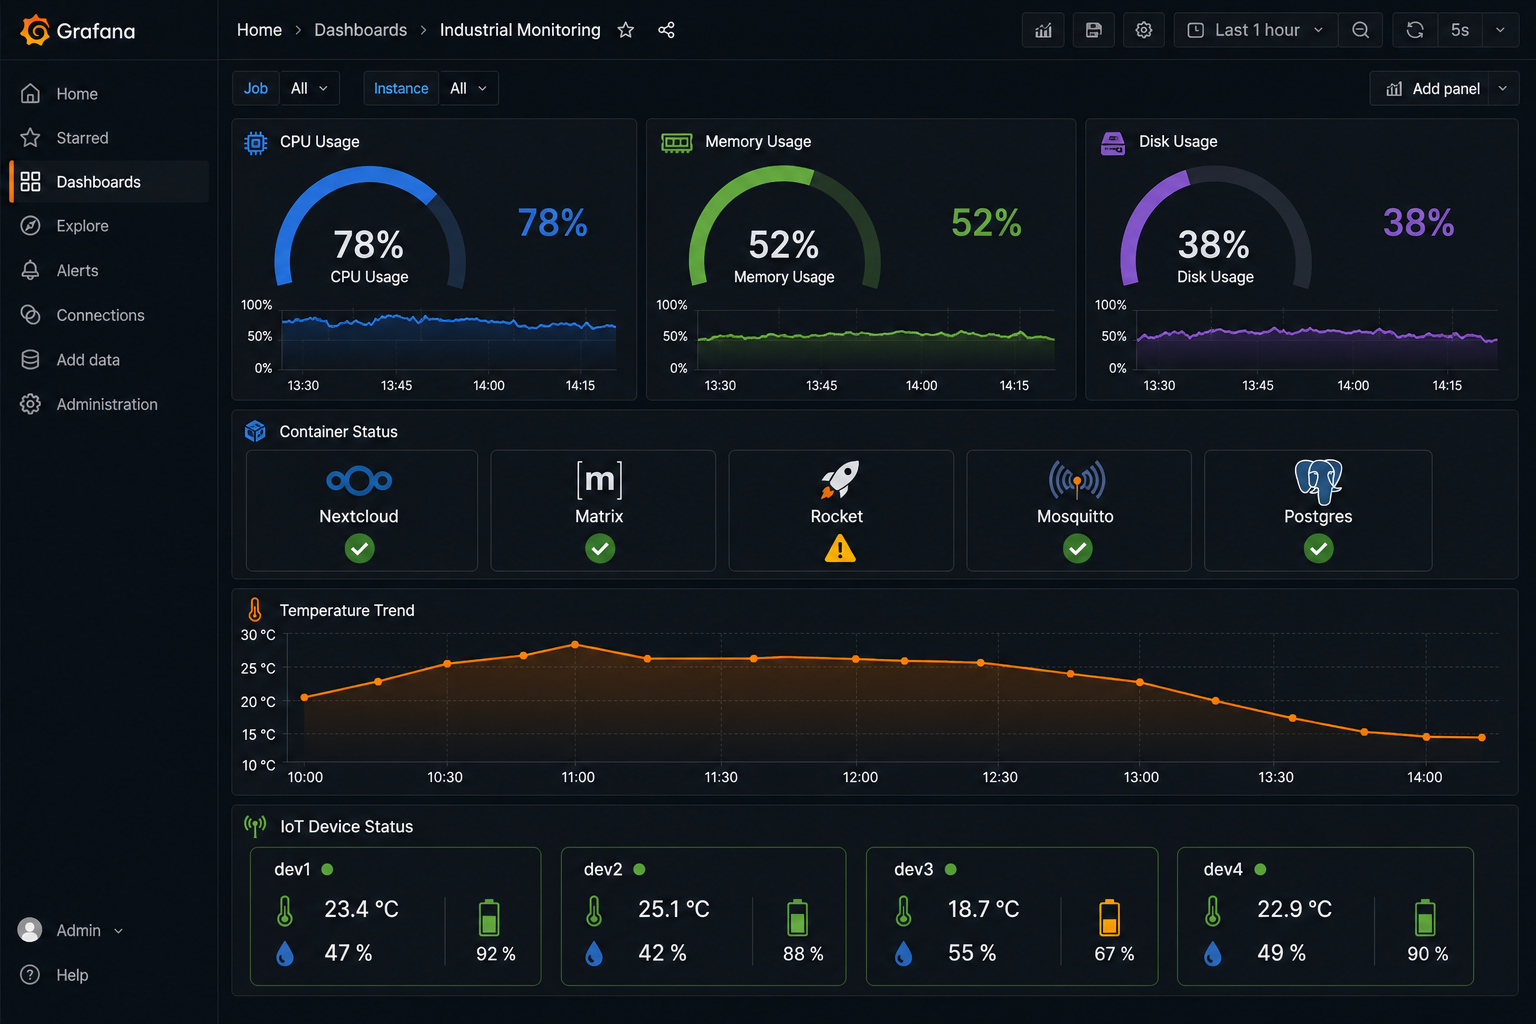
Grafana provides beautiful, real-time dashboards for all metrics:
Prebuilt Dashboards:
- Docker Host Overview – CPU, RAM, disk, network.
- Containers Overview – Resource usage per container.
- Prometheus Stats – Scrape health and performance.
- IoT Device Status – Temperature, humidity, battery.
Sample Dashboard Layout:
Key PromQL Queries
Host Metrics
# CPU usage (percent)
100 - (avg(rate(node_cpu_seconds_total{mode="idle"}[5m])) * 100)

# Memory usage (percent)
(1 - (node_memory_MemAvailable_bytes / node_memory_MemTotal_bytes)) * 100

# Disk usage (percent)
(1 - (node_filesystem_avail_bytes{mountpoint="/"} /
     node_filesystem_size_bytes{mountpoint="/"})) * 100

# Network throughput (bytes/sec)
rate(node_network_receive_bytes_total[5m])
rate(node_network_transmit_bytes_total[5m])
Container Metrics
# Container CPU usage
rate(container_cpu_usage_seconds_total{container_label_com_docker_compose_service="nextcloud"}[5m])

# Container memory usage
container_memory_working_set_bytes{container_label_com_docker_compose_service="nextcloud"}

# Container restarts
container_start_time_seconds{container_label_com_docker_compose_service="nextcloud"}
IoT Sensor Metrics
# Temperature for specific device
sensor_temperature_celsius{device="dev1"}

# Average temperature across all devices
avg(sensor_temperature_celsius)

# Humidity trend (1-hour average)
avg_over_time(sensor_humidity_percent[1h])

# Devices that haven't reported in 5 minutes
time() - max(sensor_temperature_celsius_timestamp) > 300
Real-World Deployment
This monitoring stack is running on my production infrastructure:
Current Metrics
| Component | Count | Status |
|---|---|---|
| Hosts monitored | 3 bare-metal servers | ✅ Healthy |
| Containers monitored | 42 | ✅ Healthy |
| IoT devices pushing | 12 (ESP32, LoRa) | ✅ Healthy |
| Grafana dashboards | 8 production dashboards | ✅ Active |
| Active alerts | 6 (disk space, container restarts) | ✅ Working |
| Prometheus targets | 47 active targets | ✅ All healthy |
| Data retention | 30 days | ✅ Configures |
| Scrape interval | 15 seconds | ✅ Configures |
Performance
| Metric | Value |
|---|---|
| Prometheus uptime | 99.95% over 6 months |
| Grafana uptime | 99.90% over 6 months |
| cAdvisor uptime | 100% (restartless) |
| Pushgateway uptime | 100% |
| Query response time | <100ms for recent data |
| Storage usage | ~50GB for 30-day retention |
Alerting Rules
| Alert | Condition | Action |
|---|---|---|
| High CPU | >90% for 5 minutes | Email + Telegram |
| Low disk space | <10% available | Email + Telegram |
| Container restart | Restart count >3 in 10 minutes | |
| IoT device offline | No data for 5 minutes | Email + Telegram |
| High memory | >95% for 5 minutes |
Push vs Pull – Hybrid Approach
| Mode | Use Case | Components |
|---|---|---|
| Pull | Permanent servers, VMs | Node Exporter, cAdvisor |
| Push | IoT devices, batch jobs, NAT/firewalls | Pushgateway |
| Hybrid | Industrial environments | Both (recommended) |
My recommendation: Use pull for infrastructure, push for IoT/edge, and hybrid for industrial environments. This gives you the best of both worlds.
Technology Stack
| Category | Technology |
|---|---|
| Time-Series DB | Prometheus (v2.x) |
| Visualisation | Grafana (v9+) |
| Host Metrics | Node Exporter |
| Container Metrics | cAdvisor |
| IoT Buffer | Pushgateway |
| Alerting | Alertmanager |
| Configuration | Docker Compose |
| Exposure | Traefik + HTTPS |
Related Projects
- Industrial Infrastructure Platform – The infrastructure behind monitoring.
- Scalable IoT Systems – IoT sensors and gateways.
- Embedded Systems Engineering – Firmware for monitored devices.
Key Achievements
- 47 active targets – Comprehensive coverage of all infrastructure.
- 99.95% uptime – Prometheus and Grafana over 6 months.
- 12 IoT devices – Pushing telemetry via Pushgateway.
- 8 custom dashboards – Tailored for industrial monitoring.
- 6 active alerts – Automated problem detection.
- 30-day retention – Historical trend analysis.
This monitoring stack is part of my Industrial Infrastructure Platform (II-PaaS). For a detailed architecture walkthrough or custom dashboard design, feel free to reach out.